Welcome to the first of what will be our annual survey in to the trends and behaviours of ecommerce consumers in the UK.
As a digital agency helping clients with their ecommerce strategies and technology, we have a deep interest in the behaviour of ecommerce consumers and how retailers can leverage that information to provide better experiences for their customers that help them build more profitable digital businesses. We questioned a sample of UK online shoppers about their online shopping behaviour and expectations. Here are the results…
Survey Contents & Questions
The links below will skip you to the relevant section of this page…
- Frequent online shopper age demographics
- How did you find the most-recent site from which you made an online purchase?
- Would you ever buy products online direct from a social media site?
- Have you ever bought anything online as a result of a social media recommendation?
- How do you use different devices when shopping online?
- Have you ever used a mobile for online shopping inside a physical store?
- What is your preferred payment method for online purchases?
- How important to you are customer reviews when buying online?
- What are the most important delivery considerations?
- What is your preferred delivery destination option other than your home?
- Have you ever abandoned an online purchase because of the retailer’s returns policy?
REGULAR ONLINE SHOPPERS – WHO ARE THEY?
We were interested to find out more about the demographics of regular online shoppers in 2017. We grouped respondents by age category to find out what percentage of each category have made a purchase online recently. We asked….
HAVE YOU MADE TWO OR MORE ONLINE PURCHASES IN THE PAST 30 DAYS?
The age categories of those who answered ‘yes’…
- 18 to 20: 28%
- 21 to 35: 69%
- 36 to 49: 30%
- 50 to 64: 11%
- 65+: 2%
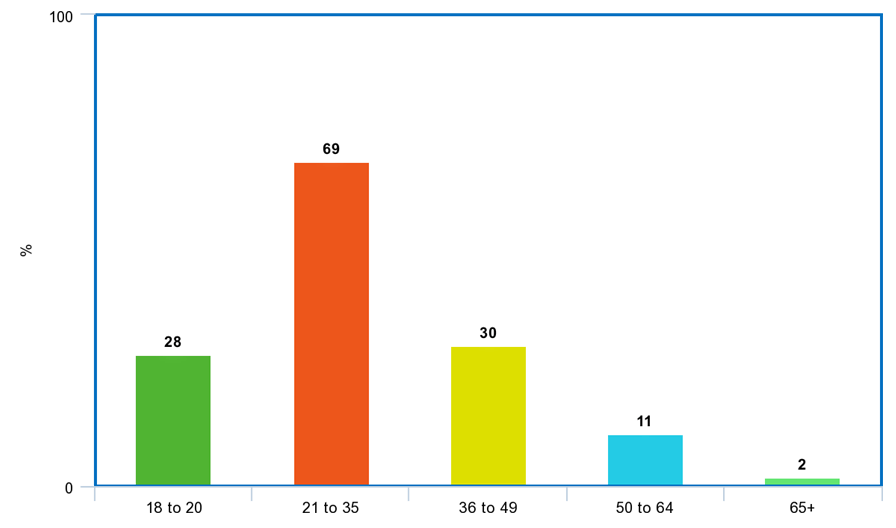
Perhaps unsurprisingly, it’s the 21 to 35 age group (often branded ‘millennials’) who appear most active when it comes to buying online. Those at the older end of the spectrum are clearly less inclined to shop online – but what’s important for retailers to note is the future trend and how it will affect their business in the years ahead.
Even if your typical customer is in the older demographic now (and apparently less inclined toward buying online), over the next 5 to 10 years, as the younger generations age in to your typical customer age category, the proportion of active online shoppers in your target demographic is only likely to increase.
If your typical customer is in the 18 to 35 age range, you are doubtless already catering to their expectations and selling to them online. This is a generation, many of whom have grown up with ecommerce as a standard part of their lives and for which not being able to buy what they want to online would be an unusual concept.
Bear in mind that the older generations will soon be filled with these individuals – to the point where eventually members of all the age categories will have grown up in the ecommerce era.
HOW DO SHOPPERS FIND WHAT THEY WANT?
Where once consumers had relatively few options to search and research their online purchases, today’s consumers live in a world immersed with digital channels and platforms. We were interested to discover what methods consumers use to find what they’re looking for and which channels influence their buying decisions. We asked the following questions to find out…
THINKING BACK TO YOUR MOST-RECENT ONLINE PURCHASE, HOW DID YOU FIND OR HEAR ABOUT THE SITE FROM WHICH YOU PURCHASED?
- Searching Google: 54%
- Advert or link on another website: 8%
- A promotional social media post: 3%
- Recommendation or share by a social media friend / contact: 5%
- From a major ecommerce site already known of: 26%
- From an offline ad (e.g. TV, billboard, radio): 4%
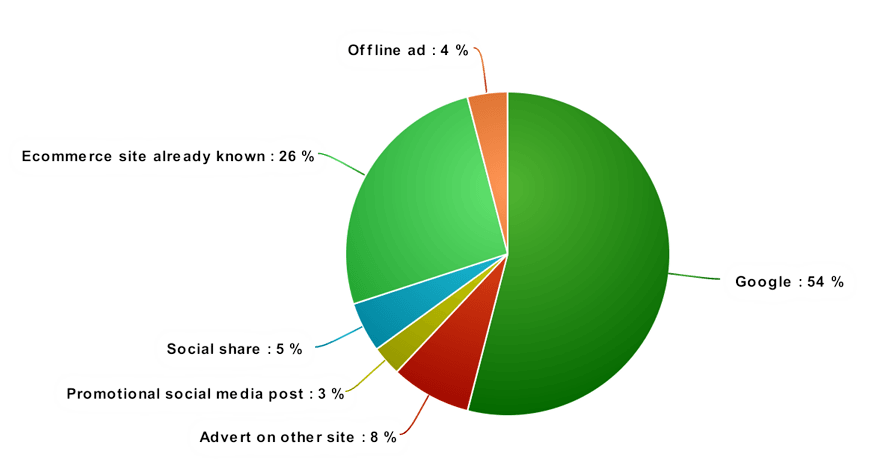
Few people would be surprised that Google is the source of the majority of ecommerce purchases among respondents. We felt the results would be too unreliable if we asked respondents to differentiate between paid or organic search results – but clearly both types of traffic play a massively significant role in ecommerce.
The big international players like Amazon and Ebay clearly hoover up a lot of ecommerce traffic – predominantly B2C but increasingly for some types of B2B product too. No smaller retailer is going to beat these giants, but you can join them and get a slice of their action by selling your products on their platforms, benefiting from their huge traffic volumes and brand recognition.
The figures for social media referrals are low, especially when compared against the results from question below, however the question specifically mentioned the respondents’ “most-recent” purchase. It should also not be discounted that a lot of brand / product awareness starts on social media, which has an influence ‘higher up the funnel’.
As sites like Facebook continue pushing to find ways to keep their users within their so-called “walled gardens” (i.e. able to do as much as possible without ever leaving their site or app), more opportunities are being developed for users to make purchases directly from within social media sites themselves. To understand more about how social media trends influence ecommerce behaviour, we asked the following questions…
WOULD YOU EVER BUY PRODUCTS DIRECTLY FROM FACEBOOK, TWITTER, INSTAGRAM OR SNAPCHAT RATHER THAN FROM A MERCHANT’S OWN WEBSITE?
Proportion who answered ‘yes’…
- Facebook: 22%
- Twitter: 12%
- Instagram: 10%
- Snapchat: 3%
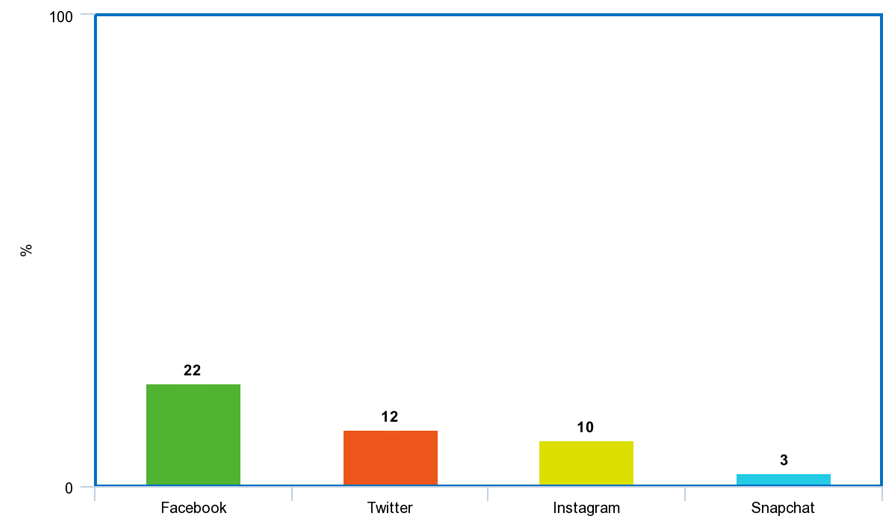
Clearly there is not an enormous appetite at present for online shopping experiences within Twitter, Instagram or Snapchat – but almost a quarter of respondents would be willing to buy products direct from Facebook, suggesting that the world’s largest social media network is a channel retailers should at least be considering now – even if not necessarily adopting right away.
We’ve already seen sites like Amazon take off as platforms for retailers to sell their own products. Customers often inherently trust these names more than they might trust a retailer’s own website – particularly if the retailer is smaller without the benefits of a recognised brand.
It therefore follows that consumers are likely to be comfortable making purchases directly through Facebook – a site which features in so many people’s everyday lives – maybe even more so than they would be when it comes to trusting their personal data to lesser-known sites.
While the numbers are not huge, with 78% of respondents saying they would not buy direct through Facebook, the number who would be prepared to is large enough that it should at least appear on the radar of retailers forming their multi-channel ecommerce strategy for the coming years.
HAVE YOU EVER BOUGHT ANYTHING ONLINE AS A RESULT OF A RECOMMENDATION OR ‘SHARE’ YOU’VE SEEN ON THE FOLLOWING SOCIAL MEDIA?
Proportion who answered ‘yes’…
- Facebook: 48%
- Twitter: 14%
- Instagram: 19%
- Snapchat: 4%
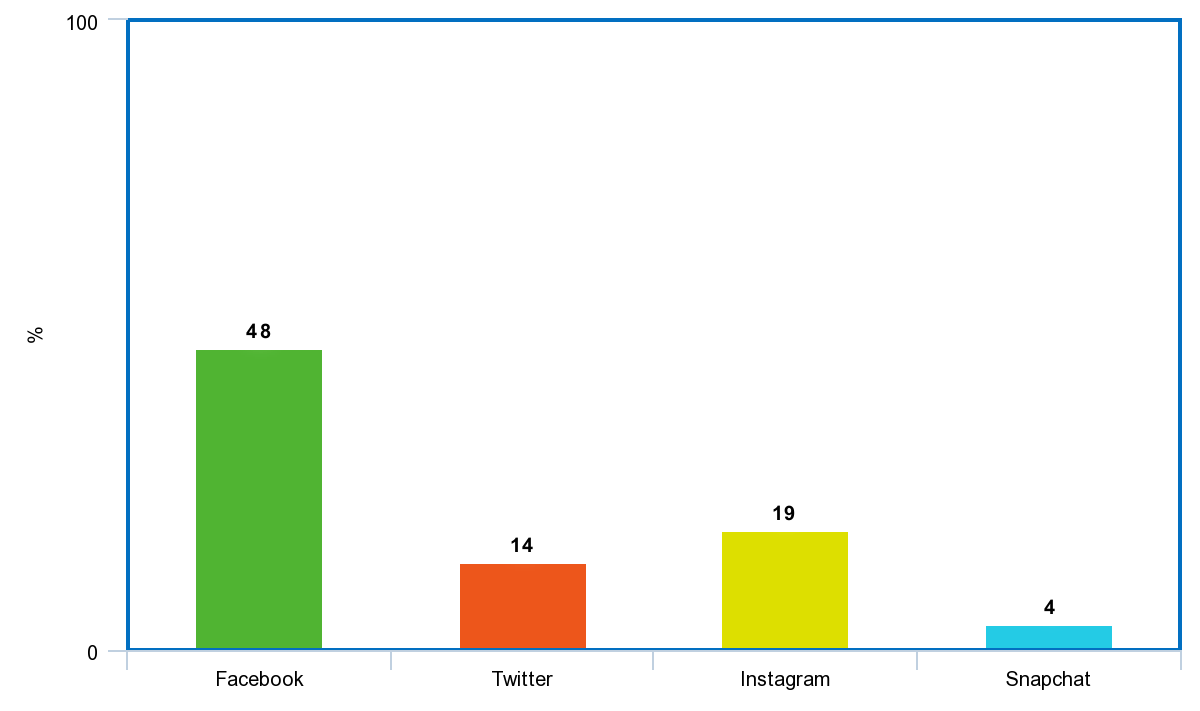
Again, the influence of Facebook is dominant here – and unsurprisingly so, given that, when it comes to buying anything, we value the opinions and experiences of our friends, families and others similar to us the most.
Depending on your sector and products, Facebook offers exceptional opportunities to gain visibility and build your brand – particularly if you can encourage natural, organic sharing, liking and commenting on your products.
The highly visual nature of Instagram, with its prevalence of celebrities and popular figures endorsing brands and products, also makes it an influential channel on ecommerce.
An important factor to consider is the number of people who may have made online purchases without realising or remembering the influence of something they’ve seen on social media – be it a paid ad or a recommendation by a friend, which could suggest the actual figures may be higher.
MAKING THE PURCHASE
Ecommerce shoppers’ behaviour is changing just as quickly as the technology and social landscape changes. How people buy products online now is very different to how they did so even just a few years ago. What are the current trends?
HOW DO YOU USE YOUR DIFFERENT DEVICES WHEN SHOPPING ONLINE?
- Most or all of my online shopping is on desktop computer: 13%
- Most or all of my online shopping is on a mobile: 11%
- Most or all of my online shopping is on a tablet: 28%
- I search and browse on a mobile / tablet and place the order on a desktop: 48%
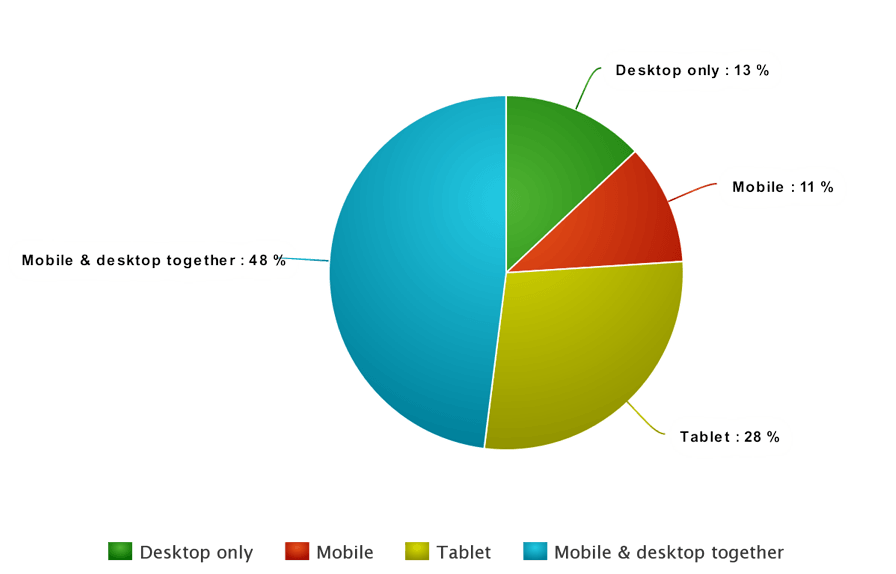
These results reflect a general trend seen across the industry over recent years for an increase in mobile and tablet usage of the web.
The figures should give some reassurance to retailers (of which we encounter many) whose mobile traffic figures are increasing but whose mobile conversion figures are not also rising in direct proportion.
The above figures would suggest most consumers are finding what they want on their mobiles or tablets and waiting until they’re in front of their desktops before making the final purchase. Mobile performance and optimisation is clearly an essential priority.
Note the fact that the combined figures for those using mobile and tablets for their ecommerce activity totals 85%, leaving only 15% of respondents whose online shopping activity takes place only on a desktop computer.
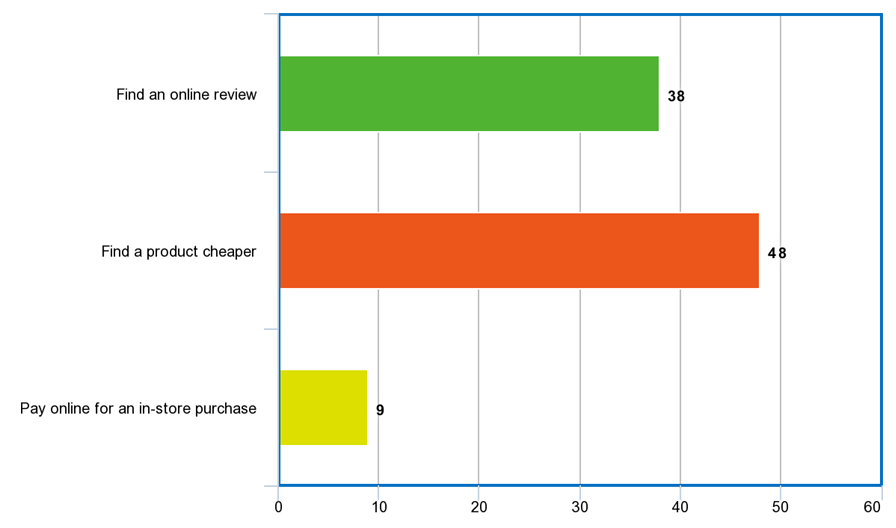
HAVE YOU EVER USED A MOBILE WHILE SHOPPING INSIDE A PHYSICAL STORE TO…
- Find an online review of a product you’re buying in-store: 38%
- Find a product at a cheaper price: 48%
- Pay online for an in-store purchase: 9%
- None of the above: 5%
The phrase ‘omni-channel’ retail is used to describe the world in which consumers research, decide upon and complete purchases across a range of different websites, social platforms and devices.
This behaviour has seen an increase in users blending the online and offline shopping experiences, for instance by so-called ‘showrooming’ (visiting a store to choose a product then finding it and buying it later online), or indeed the reverse – deciding on the product online and then heading to a store to buy it.
Some retailers actively encourage this behaviour (think Argos for instance), others find it harder to come to terms with the lower overhead, lower cost world of ecommerce cannibalising revenue from their expensive shop-front businesses.
Either way, it’s undeniable and unavoidable that the phenomenon of mobile and omni-channel ecommerce is changing consumers’ behaviour – and retailers need to accept, embrace and find ways of capitalising on it, or risk becoming irrelevant to their customers.
CHOOSE YOUR PREFERRED PAYMENT OPTION FOR ONLINE PURCHASES…
- Paypal: 46%
- Credit card: 28%
- Debit card: 23%
- Bank transfer: 2%
- Cash on delivery: 1%
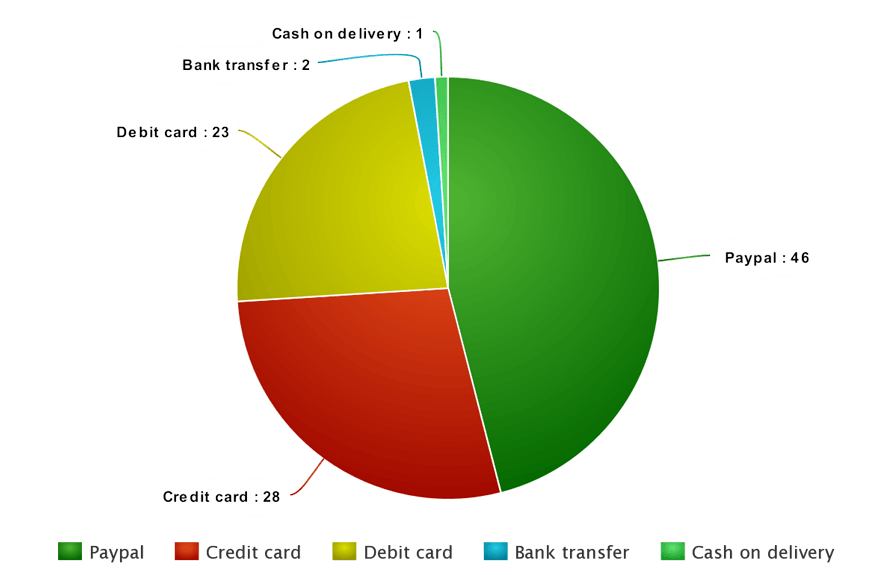
It’s interesting to note the significant preference (among our survey sample at least) for Paypal. Over the past 10-years, Paypal has gone from being a method used predominantly to buy goods on Ebay to the preferred payment method of choice across all types of ecommerce site.
Certainly when we at Advantec first began developing ecommerce sites, Paypal was often chosen by small retailers who didn’t have the background or resources to operate a formal payment gateway / merchant account solution, so had something of a stigma attached to it for being a less professional option.
Now, in 2017, it would appear Paypal should be the first payment choice option you should be offering your customers, regardless of the nature of your business. Not doing so risks alienating potentially up to half of your customer base who would prefer the security, reliability and simplicity of making a Paypal payment.
HOW OFTEN DO YOU READ CUSTOMER REVIEWS (WHERE AVAILABLE) WHEN DECIDING ON MAKING AN ONLINE PURCHASE?
- Every time / almost every time: 53%
- Sometimes: 38%
- Never: 9%
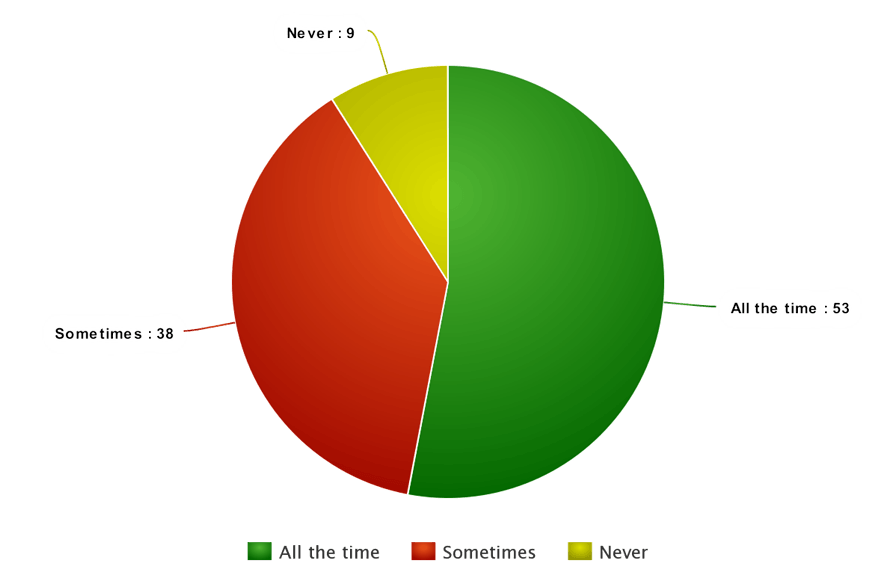
These results speak for themselves – in that a massive 91% of people put some faith in customer reviews as part of their online buying process, with just 9% saying they never do.
Customer reviews are frequently shown to increase conversion rates but retailers face a real challenge in motivating customers to leave them.
Bad reviews whenever a customer has a poor experience are always much more forthcoming than good ones when everything goes as expected. Negative reviews themselves aren’t necessarily to be feared – and we’ve even seen them increase conversion rates as long as the retailer has clearly and quickly responded rapidly in order to rectify the issue.
Third-party review platforms like Trustpilot and Feefo are increasingly popular for ecommerce retailers and aid the process of gathering reviews more frequently and quickly than you might be able to through your own platform.
DELIVERY & RETURNS
Customers’ expectations around delivery are becoming ever more demanding – and the question of how, when, where and the cost for receiving purchases has become an important part of their buying decision. To understand more about how delivery choices influence ecommerce behaviour, we asked the following questions…
INDICATE WHICH OF THE FOLLOWING DELIVERY CONSIDERATIONS IS THE MOST IMPORTANT TO YOU WHEN BUYING ONLINE
- Low cost delivery: 9%
- Fast delivery: 14%
- Same-day delivery: 17%
- Choice of multiple delivery options: 7%
- Free delivery: 49%
- Ability to track delivery: 4%
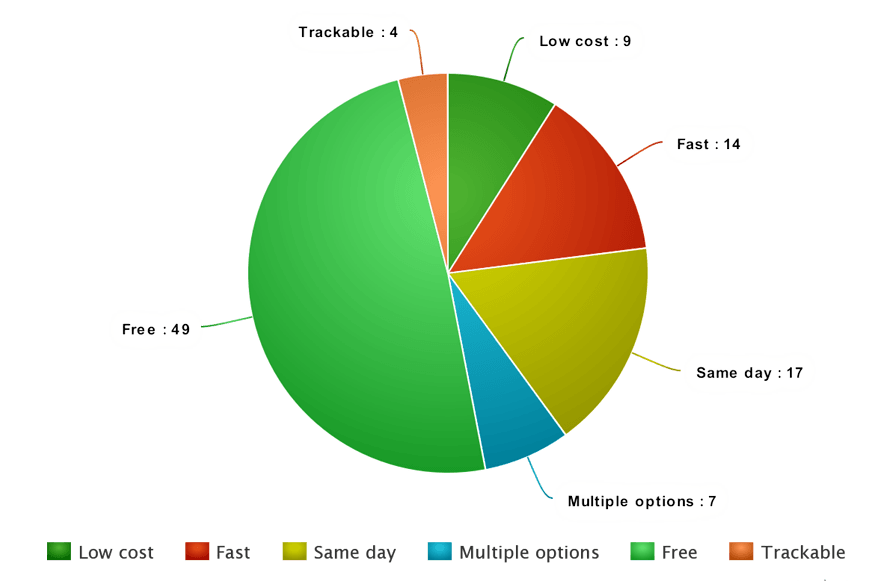
Clearly free delivery is a very significant factor in people’s online shopping decision-making process. This is something we have seen for years and which only increases in prevalence as more retailers offer the option – and more consumers begin to expect it as standard.
There are several scientific studies that show consumers often have a disproportionate and irrational response to marketing that involves the word “free”, to the point where they can be triggered to spend more, or buy something they might otherwise not have done, if doing so involves also getting something that’s ostensibly “free”. See the work of Dan Ariely, documented in his fascinating consumer psychology book ‘Predictably Irrational’ for examples.
We have seen test results where consumers have proven more likely to buy a more expensive product that has free delivery compared with the same product where the price, plus delivery charge was actually less in total!
The other interesting point here is that same-day delivery is the second-most important consideration for respondents. Just a few years ago, the concept of same-day delivery was unthinkable – but thanks to the efforts of the likes of Amazon and Argos, an expectation for same day delivery options appears to be starting to develop in consumers’ psyches. Something else that should at least now be on the radars of ecommerce retailers planning their strategies for the years to come.
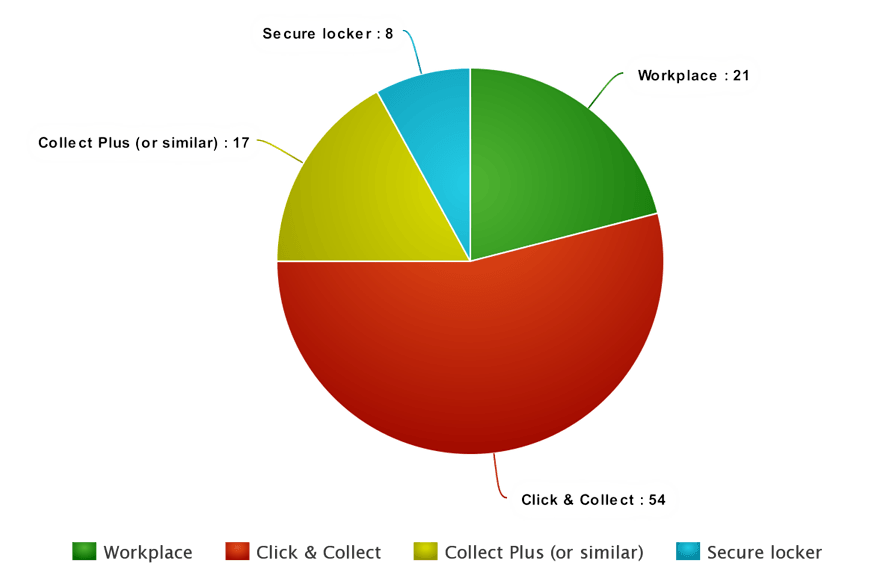
WHAT IS YOUR PREFERRED CHOICE FOR WHERE YOUR ONLINE PURCHASES ARE DELIVERED TO, OTHER THAN YOUR HOME?
- Delivery to workplace: 21%
- Click and collect (in-store): 54%
- ‘Collect Plus’ or similar local shop / pickup point delivery: 17%
- Delivery to a secure location – like Amazon ‘locker’: 8%
The ability to choose where customers receive their purchases is becoming an increasingly important consideration.
Click and collect is by far the most popular alternative to home delivery, with local pickup point delivery also a significant consideration.
Ecommerce is all about convenience, so offering multiple delivery options to customers clearly makes sense. If you have physical premises, the popularity of click and collect suggests that you should certainly be providing this as an option.
Likewise, given how relatively straightforward it is to implement a local pickup point delivery service like Collect Plus, this is something that’s clearly a worthwhile addition to your delivery options.
HAVE YOU EVER ABANDONED AN ONLINE PURCHASE BECAUSE YOU WERE NOT SATISFIED WITH THE RETAILER’S RETURNS POLICY?
- Yes: 52%
- No: 43%
- Unsure: 5%
The majority of respondents said they had aborted an online purchase specifically because the retailer was not offering (or making clear enough) a suitable returns policy.
This is a high proportion, indicative of the nature of modern consumer expectations, most-likely driven by the improvements in returns procedures made by larger retailers.
It’s a simple matter for retailers to address and is straightforward ecommerce best-practice: Make your returns policy as clear and visible as possible (particularly at the basket and checkout stages) and make them as simple and generous as you possibly can.
It’s common for retailers to find that the cost of more returns is offset by the higher number of sales that generous and clear returns policies can generate – unsurprising given how many respondents admit to abandoning their purchases as a direct result of returns policies.
SURVEY METHODOLOGY
Our research was conducted online between 1st and 28th February 2017 with 2,081 survey respondents aged between 18 and 65, all based in the UK. All respondents had made at least one online purchase in the previous six months. The survey sample was was balanced to ensure equal weighting across genders with 1,034 male and 1,047 female respondents.
Download the survey as a PDF
You can download the complete survey as a printable PDF document here